

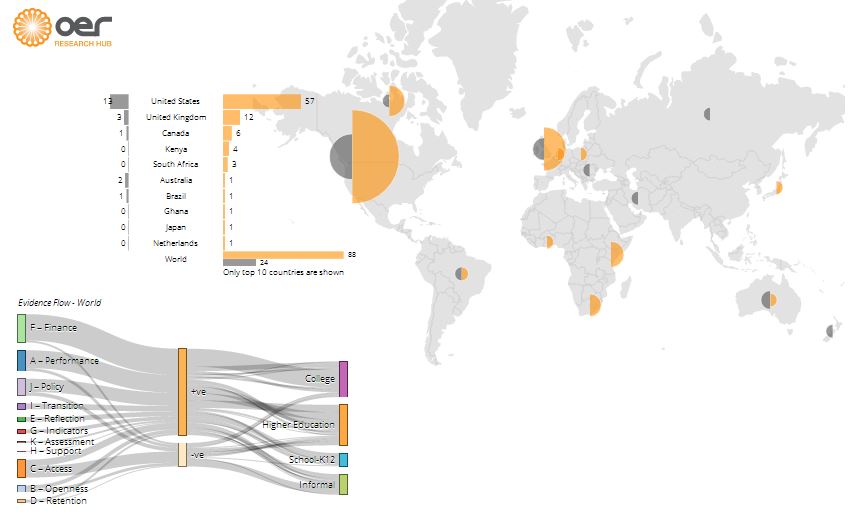
As OER Research Hub we aggregated and filtered data that relates to our research hypotheses. To see some of the evidence we gathered visit our OER Impact Map. There you will find up to date reporting on each of our hypotheses as well as summaries for different countries and help on using the site. Links are also provided to OER maps by others as well as free tools for data visualization and mapping, The full range of maps available on the site:
The OER World Map project is now the focus of OER mapping initiatives and we work closely with this team to build the effective data management system that the OER movement needs.
You can learn more about the maps by watching recent presentation(s):
- Farrow, R. OER Impact: Collaboration, Evidence, Synthesis OCWC Global 2014. Ljubljana, Slovenia. (Apr 2014)
- McAndrew, P., Weller, M., & Farrow, R. ‘Taking advantage of openness: understanding the variety of perspectives on open and their impact’ OER14: Building Communities of Open Practice. Centre for Life, Newcastle, UK. (Apr 2014)
For more on the technical development of the maps, see the following blog posts:
- Using WordPress for research data collection and visualization
- Building an evidence hub plugin for WordPress
- OER Impact Map: Rankings and recommendations are open


Leave a Reply